We have successfully completed the first phase of the project, replication of Walker and Ofria (2012). See the results in Figures 1 and 2 below:
 |
| Figure 1. Replication of Walker and Ofria (2012) results for phenotypic diversity across resource inflow rate. Panel A shows our replication, while panel B shows the original results. Similar to Walker and Ofria, we also found diversity to peak between inflow rates of 3-30. Our results were based on 30 replicate populations. |
 |
| Figure 2. Replication of Walker and Ofria (2012) results for number of populations to evolve EQU task across resource inflow rate. Panel A shows our replication, while panel B shows the original results. Similar to Walker and Ofria, we also found diversity to peak between inflow rates of 10-300. Our results were based on 30 replicate populations. |
We re-created the environment configurations in such a way as to reward the tasks based on the reward scheme outlined in Table 2 of Walker and Ofria (2012); in particular, we adjusted the value of each task to increase based on complexity of the task, and we also used the pow function to implement this reward exponentially. Figure 3 (below) shows the code for our environment configuration file:
 |
| Figure 3. Sample code for environment configuration file. Note, for each reaction, the value increases with increasing task complexity (from 1 to 5). Also, the <type=pow> command as well as <requisite:max_count=1> command were specified to change how the task reward was implemented. |
Other minor modifications were made to the configuration files to recreate the parameters outlined in Walker and Ofria (2012). The mutation rate per copy was set to 0.0025, 50 lines of "blank tape" nop-C were removed from the default organism, and the <PrintPhenotypeData> command was added to the events file so that the Shannon Diversity of Phenotypes (by task done) could be calculated for each replicate population. All other Avida settings were left at default specifications.
To analyze the data, a python script was generated to extract Shannon diversity of phenotypes from the "phenotype_count.dat" files for each replicate population and generate boxplots across each inflow rate treatment. The script was also written to take a count of every replicate population that performed the EQU task by update 100,000 and generate a histogram over each inflow rate treatment. A sample of our python code is shown in Figure 4 below:
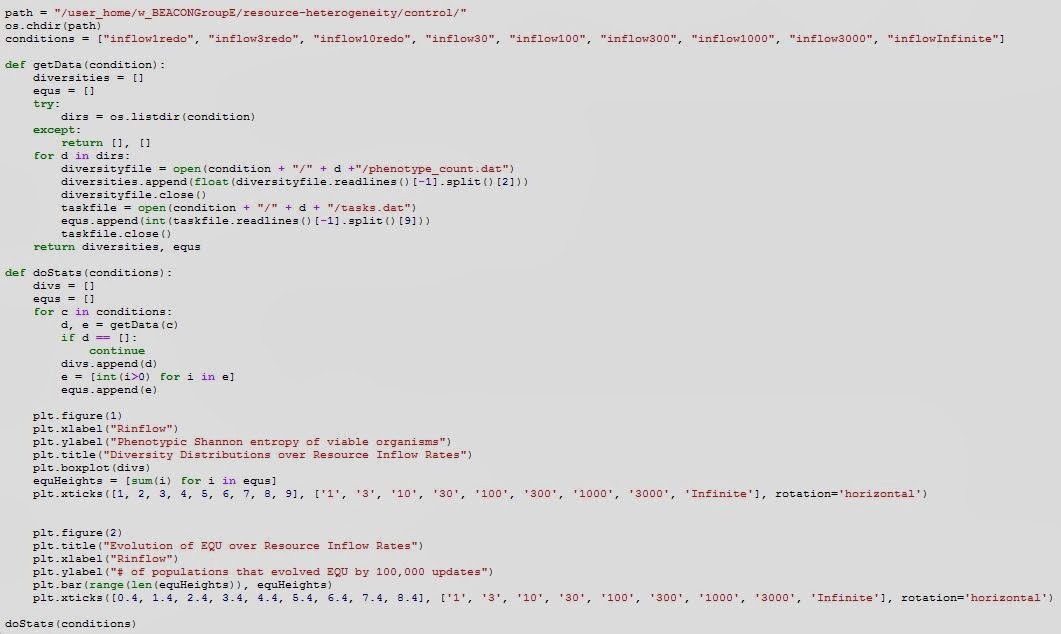 |
| Figure 4. Python script used to extract, compile and plot data from data files. |
After completing this replication, we moved on to the second phase of the project, implementing spatially heterogeneous resources and studying their effect on phenotypic diversity and evolvability of complex tasks. For more information on the progress of this extension, see the next blog post!
No comments:
Post a Comment