Thursday, May 1, 2014

Group E hard at work finalizing our final paper for the course. 

Pictured (from the left): Emily and Audra
Picture taker: Sam

End of Semester Final Presentation

See the link below for the final presentation on our project investigating phenotypic diversity and evolutionary potential in spatially heterogeneous environments:

https://docs.google.com/presentation/d/11RPEPLEZ1a__lk_rtvSlCzhDV_0ngbUv37txqTzd440/edit?usp=sharing


Progress Report Presentations

  See the link below for progress reports that tracked our work through out the semester:

https://docs.google.com/presentation/d/1Vkk0lbgAPgracuQ1ArhAcn7dVHLGe7E4U0jNpRx1hhw/edit?usp=sharing

Friday, February 28, 2014

Feb 5 Meeting Notes

Members Present: Emily Dolson, Audra Chaput, Sam Perez, Randy Olson
Objective: Get some of the logistical issues of implementing spatial heterogeneity figured out.

This post is rather late in coming. See Audra's post below for details on more recent results. We had two meetings on Wednesday, February 5th to discuss how to implement spatial heterogeneity.


From left to right: Randy Olson, Audra Chaput, Emily Dolson.
Photographer: Sam Perez


Lots of ideas being discussed.

Since gradient resources in Avida are implemented by circles, we decided to keep them that way. We decided that like Walker and Ofria (2012), we would get measurements of evolvability of a complex task (EQU) and Shannon diversity. 

One research question that we are trying to test is whether greater diversity results in greater evolvability, or vice-versa. One way to test that is by incorporating spatial resource heterogeneity, which allows us to manipulate different configurations of resource availability to organisms. These configurations will have different potential evolvabilities across the environment (because the simpler resources are not always available everywhere to make the same evolutionary jumps that occur in standard Avida). We decided that resources in patches had to be randomized between runs. We also decided to have two or three resources per patch.

February 26th Update: Implementing spatial resource heterogeneity

We've been working on the extension phase of our project, implementing resource heterogeneity. We've decide to implement resource heterogeneity spatially, by adding patches of resources associated with each task into defined areas in the world. We will be increasing or decreasing the sizes of the patches, thus changing the amount resources overlap. Isolated, small sized patches will lead to complete spatial heterogeneity, while large, completely overlapping patches will lead to complete spatial homogeneity.

Figure 1. Abstract diagram of spatial resource heterogeneity. Each  colored circle represents a patch in the world where a given resource is available at a high inflow rate. The panel on the left represents, where the patches barely overlap, represents high spatial heterogeneity. The panel on the right, where patches overlap more and up to four resources are available in a given place in the world, represents lower spatial heterogeneity.


We will be investigating how spatial heterogeneity affects phenotypic diversity. We believe that competition for resources drives diversity, and that by limiting the resources to certain areas in the world, we will be creating niches for different types of organisms to thrive in. As such, we predict similar results to Walker and Ofria (2012), in that intermediate levels of spatial heterogeneity will lead to maximum phenotypic diversity. When resources are completely heterogeneous (i.e. resources are not found in the world in conjunction with any other resources), there will be too much competition and struggle just to survive, so new phenotypes will not arise. On the other end of the spectrum, when resources are completely homogeneous (i.e. all resources are found in conjunction with every other resource), there will be no pressure to specialize in a certain set of tasks, so only generalists will thrive, leading to reduced diversity as well.

We will also be investigating how spatial heterogeneity affects the evolvability of complex tasks, specifically, the EQU task in Avida. We predict that this evolvability with peak at intermediate spatial heterogeneity as well; however, it may be possible that evolvability follows a more linear trend with spatial heterogeneity, because as resources become more homogenously distributed, there will be more of the "building block" simpler task resources available to use to do the complex EQU task.

To implement spatial heterogeneity in Avida, we are using gradient resources. Each resource is associated with one of the nine computational tasks, Not, Nand, And, Xor, OrNot, Nor, Or, AndNot, Equals

Our resources world in avida is shown below:
Figure something. Spatial resource heterogeneity.

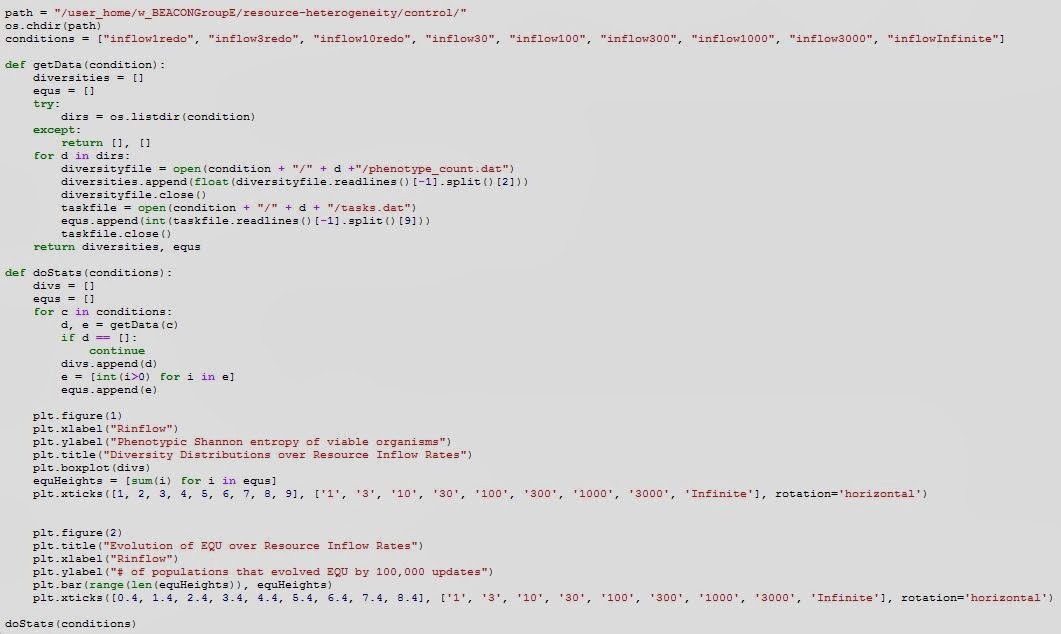
Isnt it cool. How'd we do that? We wrote a python script to randomly place each resource in two of the given patches. Here's that script below:


Figure something. Python script to randomly place resources in two patches in the world.


We are using the index of Shannon entropy of the resources in the world as a way to quantify spatial heterogeneity. To change the Shannon entropy of the resources, and thus the spatial heterogeneity, we are increasing or decreasing the radius of the patches.  Here's how we predict radius to affect entropy.
Figure of entropy vs radius.

Figure. Entropy vs patch radius.


Why? because uncertainty decreases with increasing radius until new niche is formed. Figure of heterogeneous patches to homogeneous patches.
Figure something. How overlap effects entropy.


So what have we successfully done so far? We have done, with non-depletable resources, radius 6,8,10,15,20,24,36,48,59. IE all along the entropy vs radius spectrum. Heres what we are finding, as we predicted.

Figure something. Entropy treatments (in terms of patch radius size). Top phenotypic diversity, bottom, evolve equals by update 100,000.


Next step? To make these resources depleteable within a patch. We believe this will increase competition and may lead to more diversity. Starting with inflow 100 across these different patch radii, may change the inflow rates around to see how effects.

Tuesday, February 25, 2014

February 25 Update: Replication complete


We have successfully completed the first phase of the project, replication of Walker and Ofria (2012).  See the results in Figures 1 and 2 below:

Figure 1. Replication of Walker and Ofria (2012) results for phenotypic diversity across resource inflow rate.
Panel A shows our replication, while panel B shows the original results. Similar to Walker and Ofria, we also found diversity to peak between inflow rates of 3-30. Our results were based on 30 replicate populations.

 
Figure 2. Replication of Walker and Ofria (2012) results for number of populations to evolve EQU task across resource inflow rate. Panel A shows our replication, while panel B shows the original results. Similar to Walker and Ofria, we also found diversity to peak between inflow rates of 10-300. Our results were based on 30 replicate populations.

We re-created the environment configurations in such a way as to reward the tasks based on the reward scheme outlined in Table 2 of Walker and Ofria (2012); in particular, we adjusted the value of each task to increase based on complexity of the task, and we also used the pow function to implement this reward exponentially. Figure 3 (below) shows the code for our environment configuration file:

Figure 3. Sample code for environment configuration file. Note, for each reaction, the value increases with increasing task complexity (from 1 to 5). Also, the <type=pow> command as well as <requisite:max_count=1>  command were specified to change how the task reward was implemented.
Other minor modifications were made to the configuration files to recreate the parameters outlined in Walker and Ofria (2012). The mutation rate per copy was set to 0.0025, 50 lines of "blank tape" nop-C were removed from the default organism, and the <PrintPhenotypeData> command was added to the events file so that the Shannon Diversity of Phenotypes (by task done) could be calculated for each replicate population. All other Avida settings were left at default specifications.


To analyze the data, a python script was generated to extract Shannon diversity of phenotypes from the "phenotype_count.dat" files for each replicate population and generate boxplots across each inflow rate treatment. The script was also written to take a count of every replicate population that performed the EQU task by update 100,000 and generate a histogram over each inflow rate treatment. A sample of our python code is shown in Figure 4 below:

Figure 4. Python script used to extract, compile and plot data from data files.
After completing this replication, we moved on to the second phase of the project, implementing spatially heterogeneous resources and studying their effect on phenotypic diversity and evolvability of complex tasks. For more information on the progress of this extension, see the next blog post!


February 25th Update: Replication Complete(!)


     We have successfully completed the first phase of this project, replication of  B. Walker, C Ofria (2012) Evolutionary Potential is Maximized at Intermediate Diversity Levels, Artiļ¬cial Life 13, 116-120. 


Monday, February 17, 2014

Thoughts on implementing spatial heterogeneity

One of the biggest challenges in this project will be

Our progress on replicating the original paper

After running up against a number of config file and HPCC issues, we have finally generated some data for our attempt to replicate the original paper

Friday, February 7, 2014

Feb 3, 2014 Meeting Notes

Members Present: Emily Dolson, Audra Chaput, Sam Perez
Objectives: Figure out useful ways to set up configuration files for spatial heterogeneity

We met with Aaron on Monday to discuss how to implement spatial resources into Avida. Aaron sent us a zip file with some scripts that could be useful to our project.

According to the script Aaron showed us, the height parameter is the radius  + 1, the inflow rate is around 10 units (which can be changed), and by default, the resource does not move. The script also created walls, which are bounded grids for resources, and cannot be consumed unless specified as a reaction.

Since there will be some regions of the overworld where there are no resources, a visual sensor is necessary to see the resource from a distance to prevent death. The visual sensor has four input and 8 outputs, and the LOOK_AHEAD instruction is how the visual sensor is executed.

We can also use the MOVIE DATA option to get movies for organisms; then we can use Python to read and analyze.


Wednesday, February 5, 2014

Jan. 28 Meeting Minutes


Project Name: Does Spatial Heterogeneity Increase Evolvability?
Group Members: Emily Dolson, Audra Chaput, Samuel Perez
Paper to be Replicated: B. Walker, C Ofria (2012) Evolutionary Potential is Maximized at Intermediate Diversity Levels, Artiļ¬cial Life 13, 116-120.
Date: Jan. 28, 2014
Notable Discussion:
On Tuesday (Jan. 28), Emily and I briefly­­­ talked about Emily’s slide pitch. In this project, we will replicate the paper by Walker and Ofria 2012, which concluded that intermediate resource inflow across the landscape resulted in higher Shannon entropy and more populations evolving a complex trait (EQU) than a low or high resource inflow. The main extension to this paper will be to add spatial heterogeneity to Walker and Ofria’s model, which will be incorporated by separating the landscape into 8 different resource gradients (imagine 8 non-overlapping circles across the grid), and randomizing them each time we go through a run to minimize spatial-resource bias. This will allow us to examine whether more populations can evolve the complex trait than if the resources were evenly scattered across the landscape. We could also measure Shannon entropy to get an estimate of diversity represented across the whole landscape. Finally, we can further extend this project by doing all two-pair combinations of resources across the grid (28 different combinations for 8 resources), such that there are two resources in each part of the grid, and then tabulating the number of populations that can perform the complex task at the end of each run.   
Next Meeting: To be decided
Goals for Next Meeting: Everybody should read the paper to be replicated, and come up with some questions about the paper and the goals, extensions, and potential problems that we will need to address. If you have time, look at some configuration options for the environment and resources and see if any potential options would be useful to the project. Also, setting a consistent schedule for future meeting would be welcome by all (bring your calendars).
Graduate Mentor: Randy Olson